


If you have a lot of slicers then you are going to have a lot of pages, this method can save space on each page.
It has some disadvantages, since the slicers are hidden, the only way to show filters are either building dynamic titles or hovering over the filter icon of a visual. It's not recommended for reports for looking up users or orders where opening and closing the slicer panel would hinder the user experience. Let's look at an example report I created:
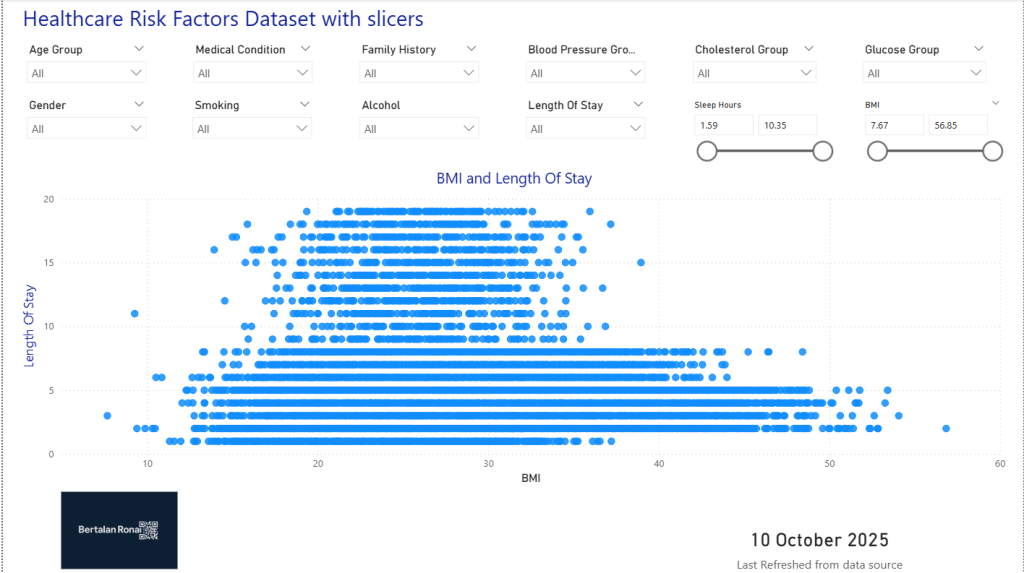
You might think that it does not take up too much space but in practice developers and stakeholders are creative people and they usually come up with a number of new calculated columns for slicers. Where would you add the next one?
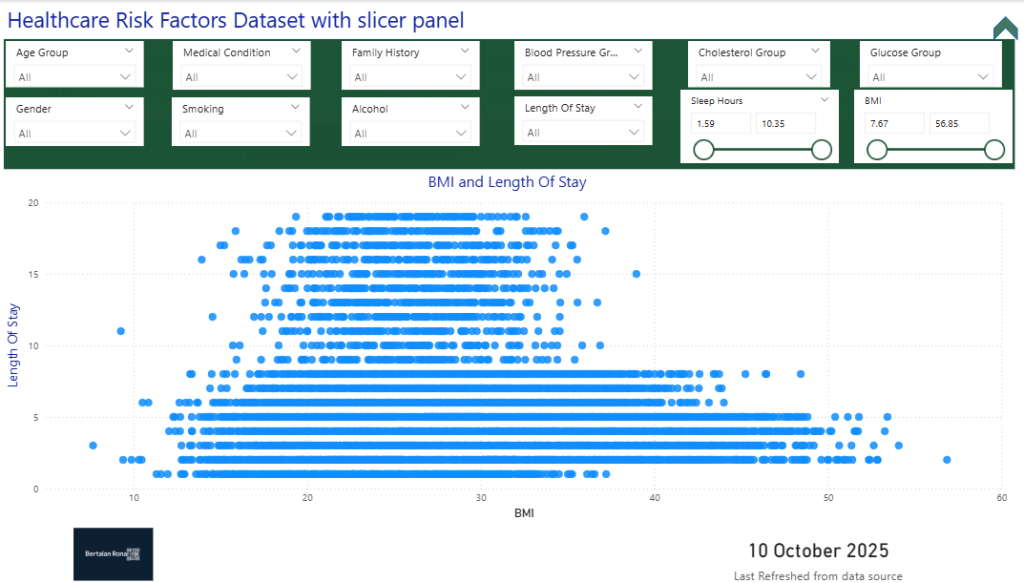
Here is the same page with a toggle button (shape) for opening and closing a slicer panel. You can see how I used the space on the canvas that this method freed up.
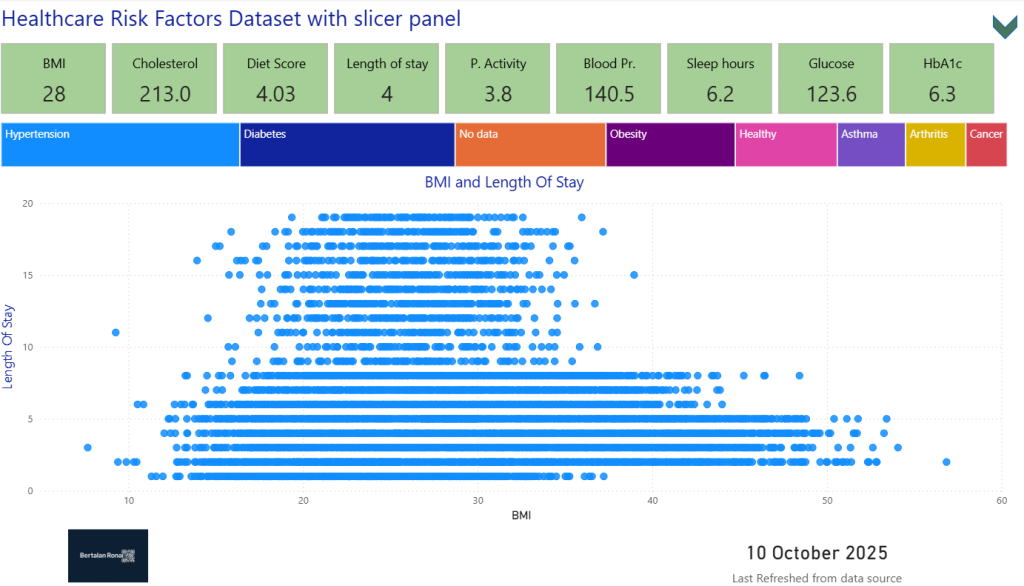
I think the version with the card and treemap visuals looks better, the hidden panel can easily allocate more slicers if necessary and does not cover the charts.
"How to Build It: A Step-by-Step Guide"
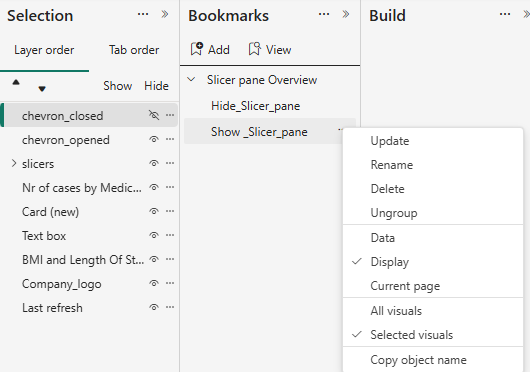
I used a built in chevron shape, grouped the slicers, created a background panel shape and two bookmarks. One bookmark saves the open panel view, the other saves the closed view.
"Step 1: Create Your Slicer Panel"
First, add a new shape to act as the background for your panel (e.g., a rectangle). Open the selection pane and place all your slicers on top of this shape.
Step 2: Group Your Objects
Select the background shape and group all your slicers. Rename this group to something intuitive, like 'Slicer Panel Group Overview page
Step 3: Add Your Toggle Buttons
I used a built-in chevron shape, but you can use any icon or button. The icons should imply behavior such as opening and closing. Place them where you want the user to click to open and close the panel, place them exactly on top of one another. Only one of them is going to be visible and the bookmarks are "switching" between them. The shape / button should indicate the state and functionality, that's why I use the chevron. A bookmark hides the slicers and the opening shape and a second one reveals the slicers and the closing shape.
Step 4: Configure Your Bookmarks
This is the more difficult step but it's easy to fix any mistakes. We'll create two bookmarks.
Bookmark 1: 'Slicer Panel Open:
With the 'Slicer Panel open or visible, go to the Bookmarks pane and click 'Add'. Rename the bookmark to 'Slicer Panel Open'. Click the three dots next to the bookmark and make sure 'Data' is unticked - not selected. This is crucial to prevent the bookmark from resetting your filter selections. Only selected visuals and display should be selected. Don't forget to close the filter pane when creating or updating the bookmarks.
Bookmark 2: 'Slicer Panel Closed:
Now, hide the 'Slicer Panel Group' using the eye icon in the Selection pane. Click 'Add' in the Bookmarks pane again. Rename this bookmark 'Slicer Panel Closed. Select the same options as in the previous step.
Step 5: Assign Actions to Your Shapes
Assign the 'Slicer Panel Open' bookmark to your toggle shape in the shape's Action properties. Then, you'll need a 'close' button inside your slicer panel and assign the 'Slicer Panel Closed' bookmark to it.
You can download the example file from my Github page. You need to hold CTRL key in Power BI desktop to activate the bookmarks during development, in the published reports users can just simply click on the shapes / buttons.