


I'll demonstrate the behavior of the percentile calculations through a case study translated to the contoso data model.
The concept of percentiles
Let's build on our understanding of the median function. The median groups or sorts the data points into 2 groups by identifying a limit or boundary between them.
Half of the data points are less than the boundary and half of them are greater than.
Let's create a calculated table and a measure to test:
Series = GENERATESERIES(1,10,1)
Series First Percentile Limit = PERCENTILE.EXC(Series[Value], 1/2)
The difference between the PERCENTILE and the PERCENTILEX functions that you can define a table for the calculation, it can be useful if your data source is not ideal for your purposes and you want to run the function on a temporary table.
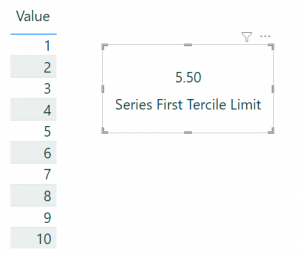
The limit is 5.5 to divide the values into 2 groups. 5.5 is the average of 5 and 6. Changing the 1/2 in the measure to 1/3 creates terciles or tertiles, it divides the data points into 3 bins with approx. equal number of data points. If you have 9 apples and you wanted to group them by size, it would group them into groups of 3, the first tercile would have the smallest apples and the third would have the biggest ones.
Refusal to calculate over an insufficient number of data points.
Let's use this table: Series = GENERATESERIES(1,2,1), it results in a table with only two data points, 1, 2.
Series First P. Limit V2 = PERCENTILEX.EXC(Series, Series[Value], 1/4)
This measure is trying to put the data points in 4 groups with equal number of data points. You can't put 2 data points into 4 groups, that is what the measure's error message is trying to tell us:
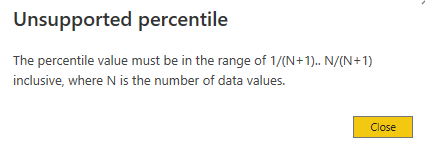
If you have 10 values (N=10) then the percentile value must be in the range of 1/11 and 10/11. (You can test it)
It is very important to defend against this error message to improve user experience. For the remaining part of this article, I'll use the Contoso database or DWH. Most BI developers are familiar with this one, this is the one used for the Definitive Guide to DAX book and the dax.do webpage.
In my model I have merged the Store and the Geography tables to have a starchema model.
Sales = SUM ( FactSales[SalesAmount] )

Sales 1st Tercile  Limit =
VAR k = 1/3
VAR TT =
SUMMARIZE(FactSales,  Dim_Store[Store Name])
VAR NumValues =
COUNTROWS(TT)
VAR LowerBound = 1 / (NumValues +1 )
VAR UpperBound = NumValues / (NumValues + 1)
VAR Predicate = AND(k >=LowerBound, k<=UpperBound)
VAR Result =
PERCENTILEX.EXC(TT,[Sales], k)
RETURN
IF(Predicate, Result)
K is the nr of groups or bins you want to create within the whole (1) set of data points. TT is a temporary calculated table that defines a granularity suitable for our analysis. In this case I want to dynamically group the stores into terciles by the selected slicers. The Predicate variable is determining whether the percentile range is within the allowed range, the result is only calculated if the predicate is true.
To have enough data points for the calculation there must be more than 2 stores (data points) in the filter context. If you select 2 store names, you don't get an error message but your result is not clear.
Instead of modifying the code to prevent showing only 2 stores, I recommend not using the store name slicer on the page, if you only select the country then you will always have more than 3 stores. Correction: Denmark has 1 store so you would have to select another country besides it to have more data points.
The 2nd Tercile limit is the same measure but the k is 2/3.
Sales Tercile Numeric =
VAR Measuredby = [Sales]
VAR LimitOne = CALCULATE([Sales 1st Tercile  Limit], ALLSELECTED(FactSales))
VAR LimitTwo = CALCULATE([Sales 2nd Tercile  Limit], ALLSELECTED(FactSales))
VAR Result =
SWITCH(TRUE(),
ISBLANK(Measuredby), BLANK(),
Measuredby < LimitOne, 1,
Measuredby < LimitTwo, 2,
3)
RETURN
Result
The Sales Tercile Numeric measure is grouping the values of the measure in the measured by variable into 3 groups. The blank possibility in the SWITCH might seem redundant but it can be useful if you want this to evaluate in a filter context where the measure is blank but you don't want to group the blank as the 1st tercile. First try these measures without the ALLSELECTED modifier! We get the same unsupported percentile error message because the limits are evaluated store by store.
The modifier's purpose of making sure that the evaluation of the limits is calculated over all the elements, all the stores within the filter context because the calculation is dependent on all the stores.
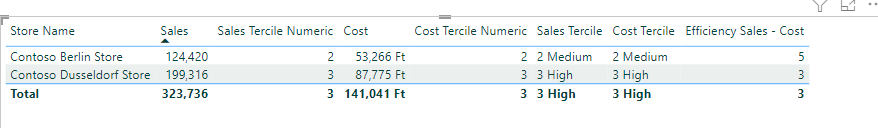
Sales Tercile =
SWITCH([Sales Tercile Numeric],
1, "1 Low",
2, "2 Medium",
3, "3 High")
Please create or imagine the same measures with cost (TotalCost). The following measure creates an efficiency matrix out of the two terciles. The case when either or both measures are blank is dependent on the business context, in the context of the Contoso database there is no sales without cost but you could have cases where one can exist without the other. Unlike the sales the cost is lower the better, therefore the best case is if a store belongs to the biggest sales tercile and the lowest cost tercile.
Efficiency Sales - Cost =
VAR SalesT = [Sales Tercile Numeric]
VAR CostT = [Cost Tercile Numeric]
VAR Result =
SWITCH(TRUE(),
ISBLANK([Sales]) || ISBLANK([Cost]), 0,
SalesT= 3 && CostT =1, 1,
SalesT= 3 && CostT =2, 2,
SalesT= 3 && CostT =3, 3,
SalesT= 2 && CostT =1, 4,
SalesT= 2 && CostT =2, 5,
SalesT= 2 && CostT =3, 6,
SalesT= 1 && CostT =1, 7,
SalesT= 1 && CostT =2, 8,
SalesT= 1 && CostT =3, 9)
RETURN
Result
Target definition:
Let's say that we want to declare a target for the stores, the sales target is the average sales where the Efficiency category is less than 5. Hmm, it is a really tough calculation because you don't know which store belongs to the 1 without evaluating all of them in a filter context. What I came up with is the following. Yes, context transition is cool.
Sales Target by Efficiency =
AVERAGEX(
    FILTER(Dim_Store,
    [Efficiency Sales - Cost] <5),
    [Sales])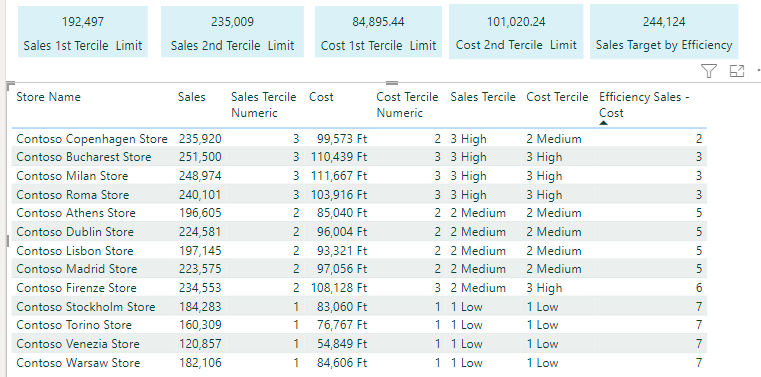
Recommended links:
DAX PATTERNS: https://www.daxpatterns.com/statistical-patterns/
I want to thank Owen Auger for his helpful comments in this thread:
Community Forum Thread: https://community.powerbi.com/t5/Desktop/Percentile-exc-Error/m-p/637337